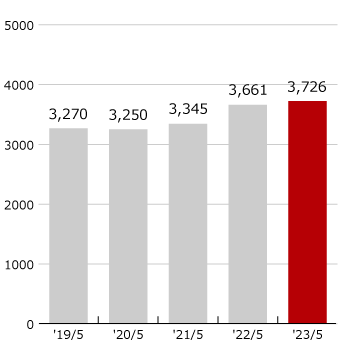
(Millions of yen)
*Note:
- The Company conducted a 1:100 stock split on common stock with an effective date of December 1, 2013, at the same time, adopted a unit share system that set unit share at 100 shares.
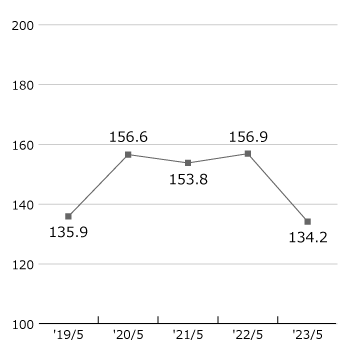
Net Sales
(100 Millions of Yen)
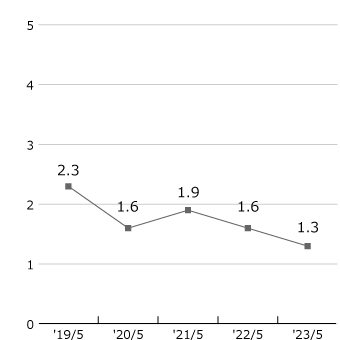
Operating Income Margin
(100 Millions of Yen)(%)
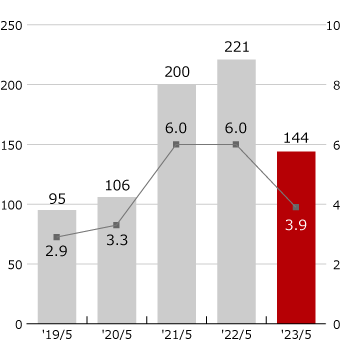
 Operating income
 Operating income ratio
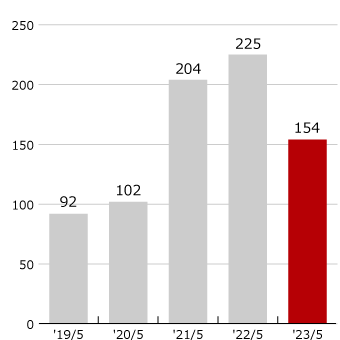
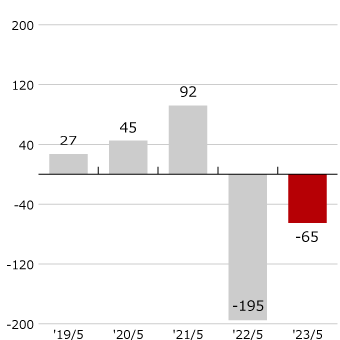
Ordinary Income
(100 Millions of Yen)
Net Income and EPS
(100 Millions of Yen)(Yen)
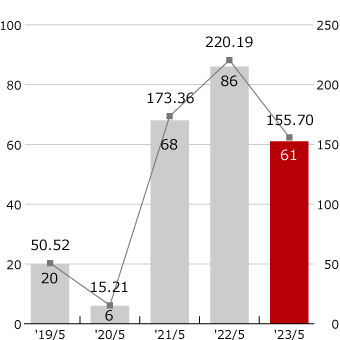
Net Income
Net Income per Share
Current Ratio
(%)
Free Cashflow
(100 Millions of Yen)
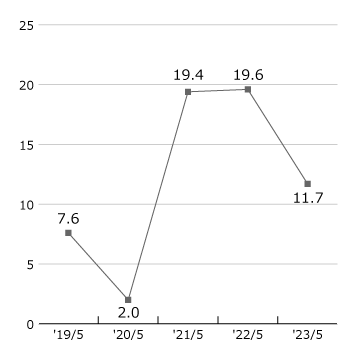
ROE (Return On Equity)
(%)
PBR (Price Book value Ratio)
(%)
For more details [ Investor's Guide ]