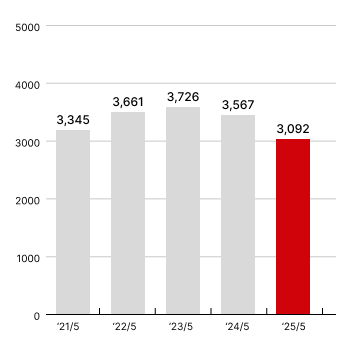
(Millions of yen)
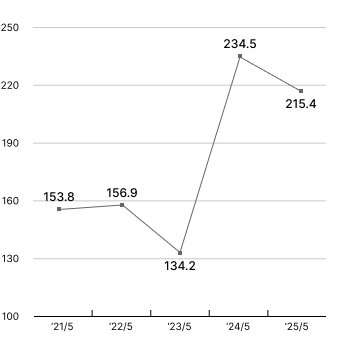
Net Sales
(100 Millions of Yen)
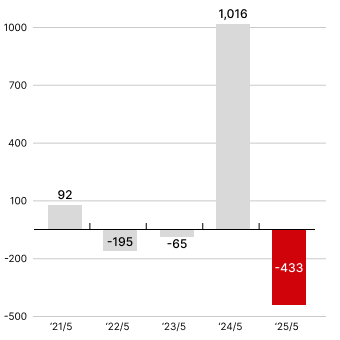
Operating profit (loss)
(100 Millions of Yen)(%)
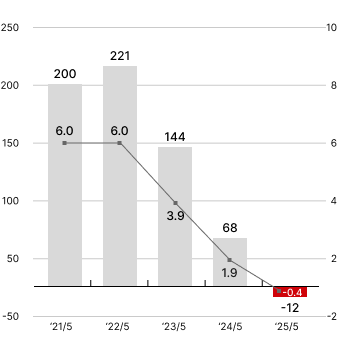
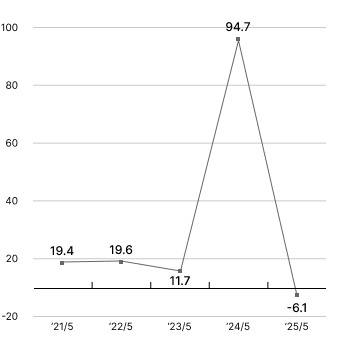
 Operating income
 Operating income ratio
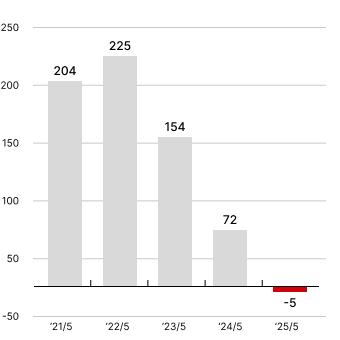
Ordinary profit (loss)
(100 Millions of Yen)
Profit attributable to owners of parent and Net profit per Share (Yen)
(100 Millions of Yen)(Yen)
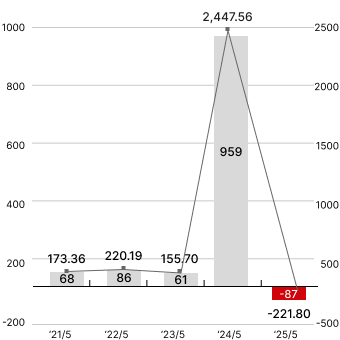
Profit attributable to owners of parent
Net profit per Share (Yen)
Current Ratio
(%)
Free Cashflow
(100 Millions of Yen)
ROE (Return On Equity)
(%)
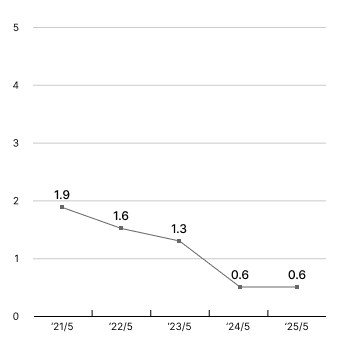
PBR (Price Book value Ratio)
(%)
For more details [ Investor's Guide ]